
.png
)
Value Stream Mapping (VSM) is a lean technique used in manufacturing to analyze & manage the design and flow of information & materials to provide satisfactory products to the customers.
Each step in a process can be documented with the use of specialized flowchart symbols. VSM provides a visual representation of the process from the beginning till the end. Flowcharts used for VSM utilizes symbols called as ‘Language of Lean’ to outline and refine the flow of information and material in a process. It is known as an elemental technique for identifying, reducing process cycle times and implementation of process improvements. VSM consists of the process steps along with flow of information and various other salient data which maybe of prime concern for the process. VSM helps in creation of organizations plan for maximizing the available resources and ensuring that time and materials are efficiently used. Value added items can be separated from the nonvalue added items by VSM, thus improving the process.
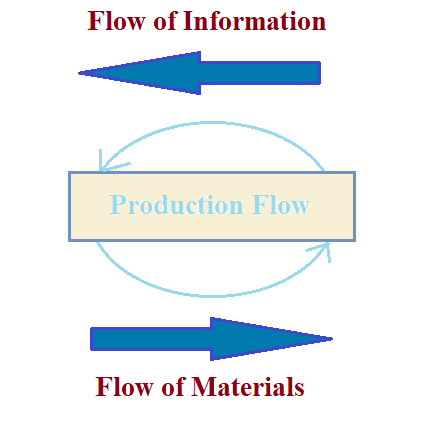
VSM starts from the customer leading towards the path of the supplier and visually showing the various processes including the flow of material and information featuring a ‘Current State Map’. Optimization of the Current state map is called as Future State Map. Flow of information (information on how and what to be executed for the operation) is always from right towards left and the flow of materials (material movement in the operation) is from left to right.
In addition to providing flow of information and materials, VSM is also beneficial for effective collaboration and better teamwork by promoting better communication among the team. Excessive wait time between the processes which is the major concern of waste leading to less productivity and substandard quality can be ruled out by VSM. Production process can be streamlined by mapping the process. VSM can focus both on customer delivery and product flow in the process, thus leading to continuous delivery.
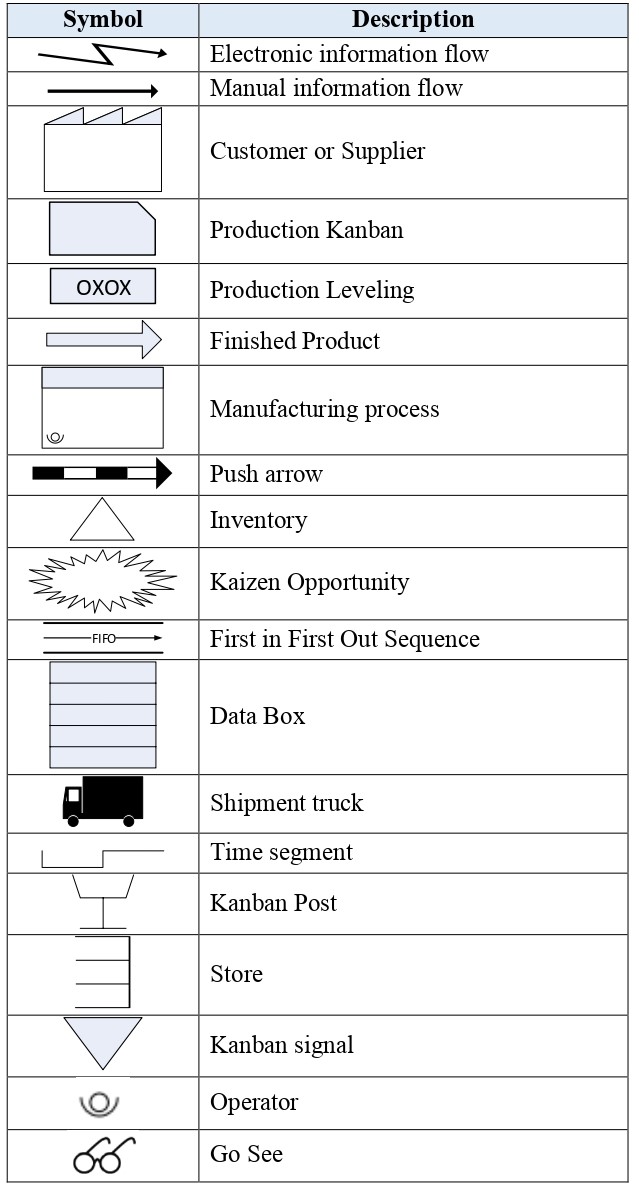
The flowchart used in Value Stream Mapping uses various specialised symbols which are as follows:
Steps for generating Value Stream Mapping are:
- Product Family/Process is selected
Only one product family should be selected for initiation of the Value Stream Mapping which consists of the same processing steps. All the processing steps of the product family are visually identified so its important to differentiate it from other product families. A matrix can be created with operations and products in case of a complicated product mix process.
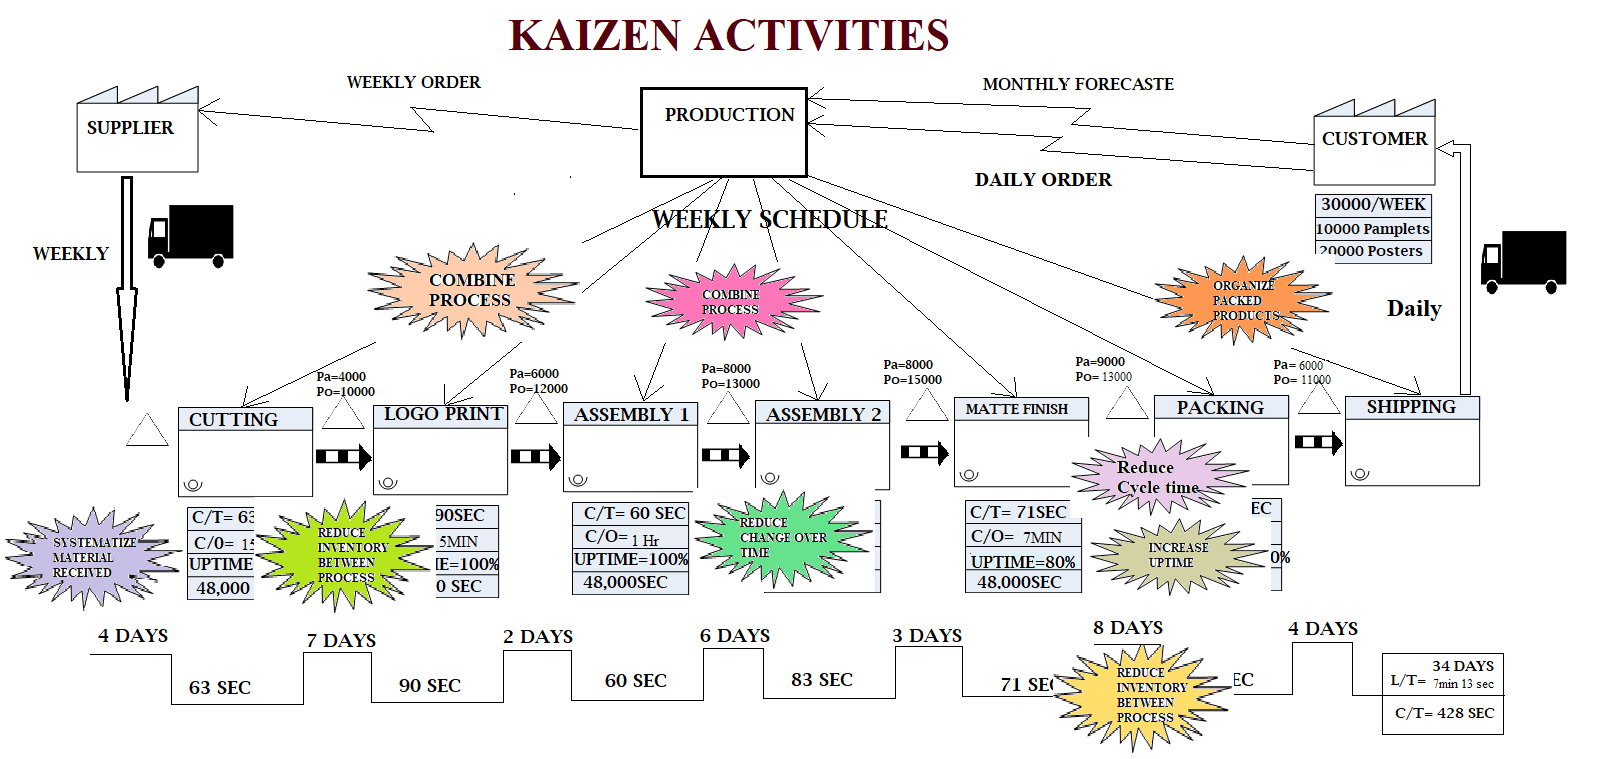
- Current State Map identification
Process is analysed by creating a Current State Map. Features of a Current State Map are as follows
- Begins with the customer
- Information flow is from right and material flow is from the left
- Data shall be collected personally
- Whole stream is mapped
- Value Stream Map shall be created with a pencil
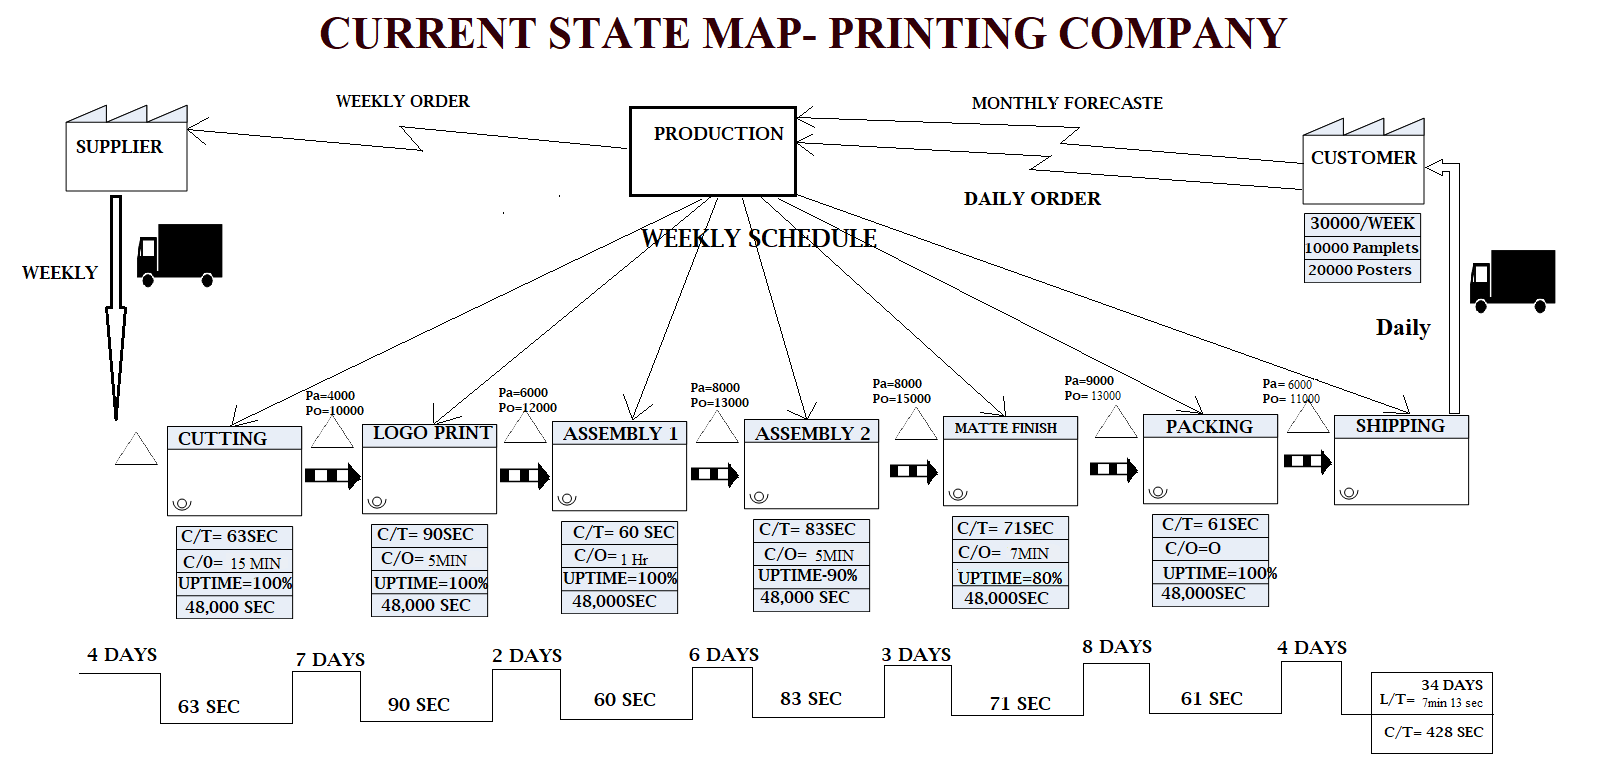
Procedure for designing Current State Map:
- Process boundaries should be assigned
- Customer requirements is drawn at the right side
- Flow of information from the Customer to the Production is towards the left direction where the process is forecasted and further towards the supplier for procurement of materials
- Production processes is drawn for every individual process to show the flow of materials
- Flows among processes are drawn
- Data is recorded with each of the processing steps which are:
-
- Cycle Time (C/T) = Time to finish one process cycle
- Change Over Time (C/O) = Time required for switching from one process to another
- Lead Time (L/T) = Total time taken by the process
- Number of operators required for the process
- Working Time available for every shift of the process
- Machine uptime, i.e.-machine availability time
- Production batch size
(Timeline showing the cycle time and lead time of each process individually and combined time is drawn at the bottom of the map)
7. Non-value added process and/or wastes are identified and indicated on the Current State Map for implementation of Kaizen opportunities to reduce the nonvalue added processes. Some of the common wastes are:
-
- Long lead time/cycle time
- Unstable environment
- Test failures
- Process delays
- Presence of excess steps
- Supplemental Inventory
- Constraints
- Machine downtime
- Unorganized process
- Scrap/Rework
- Overproduction
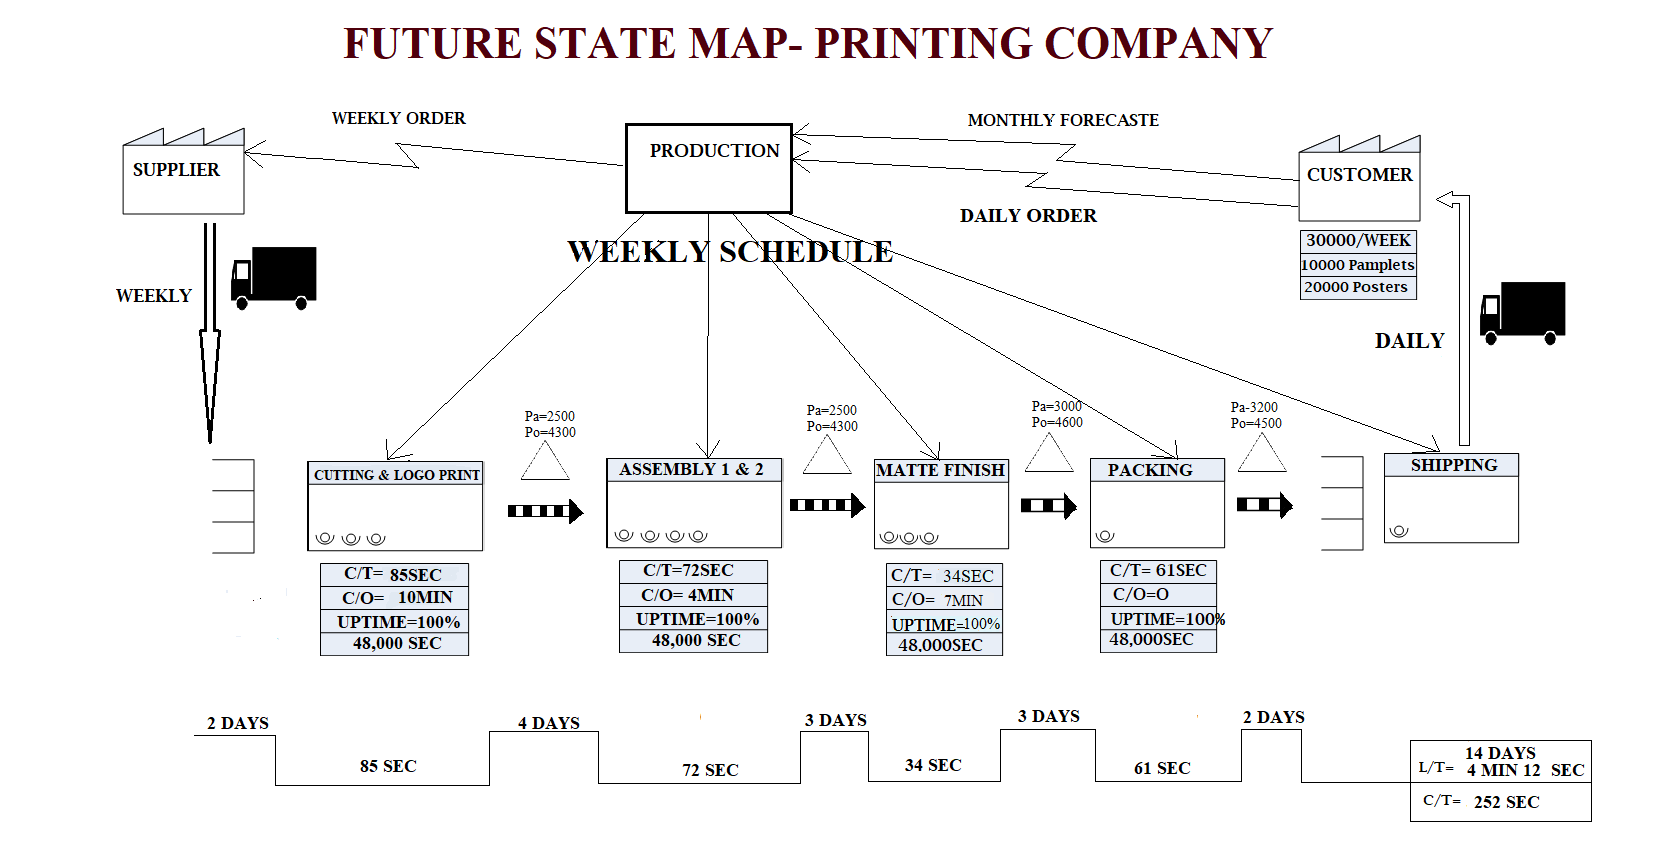
- Future State Map creation
Future State Map is developed to eliminate the delays/waste present in the process after incorporating the Kaizen opportunities on the Current State Map. Main significance of the Future State Map is to improve the process. The Future State Map developed should align with the vision of the company. Adjustment to the process should be made on the continuous basis fulfilling the customer requirements. The problems depicted in the Kaizen activities should be solved while developing the Future State Map.
KPIs should be monitored regularly and trends analysed to keep the process in state of control to produce the maximum value-added products.
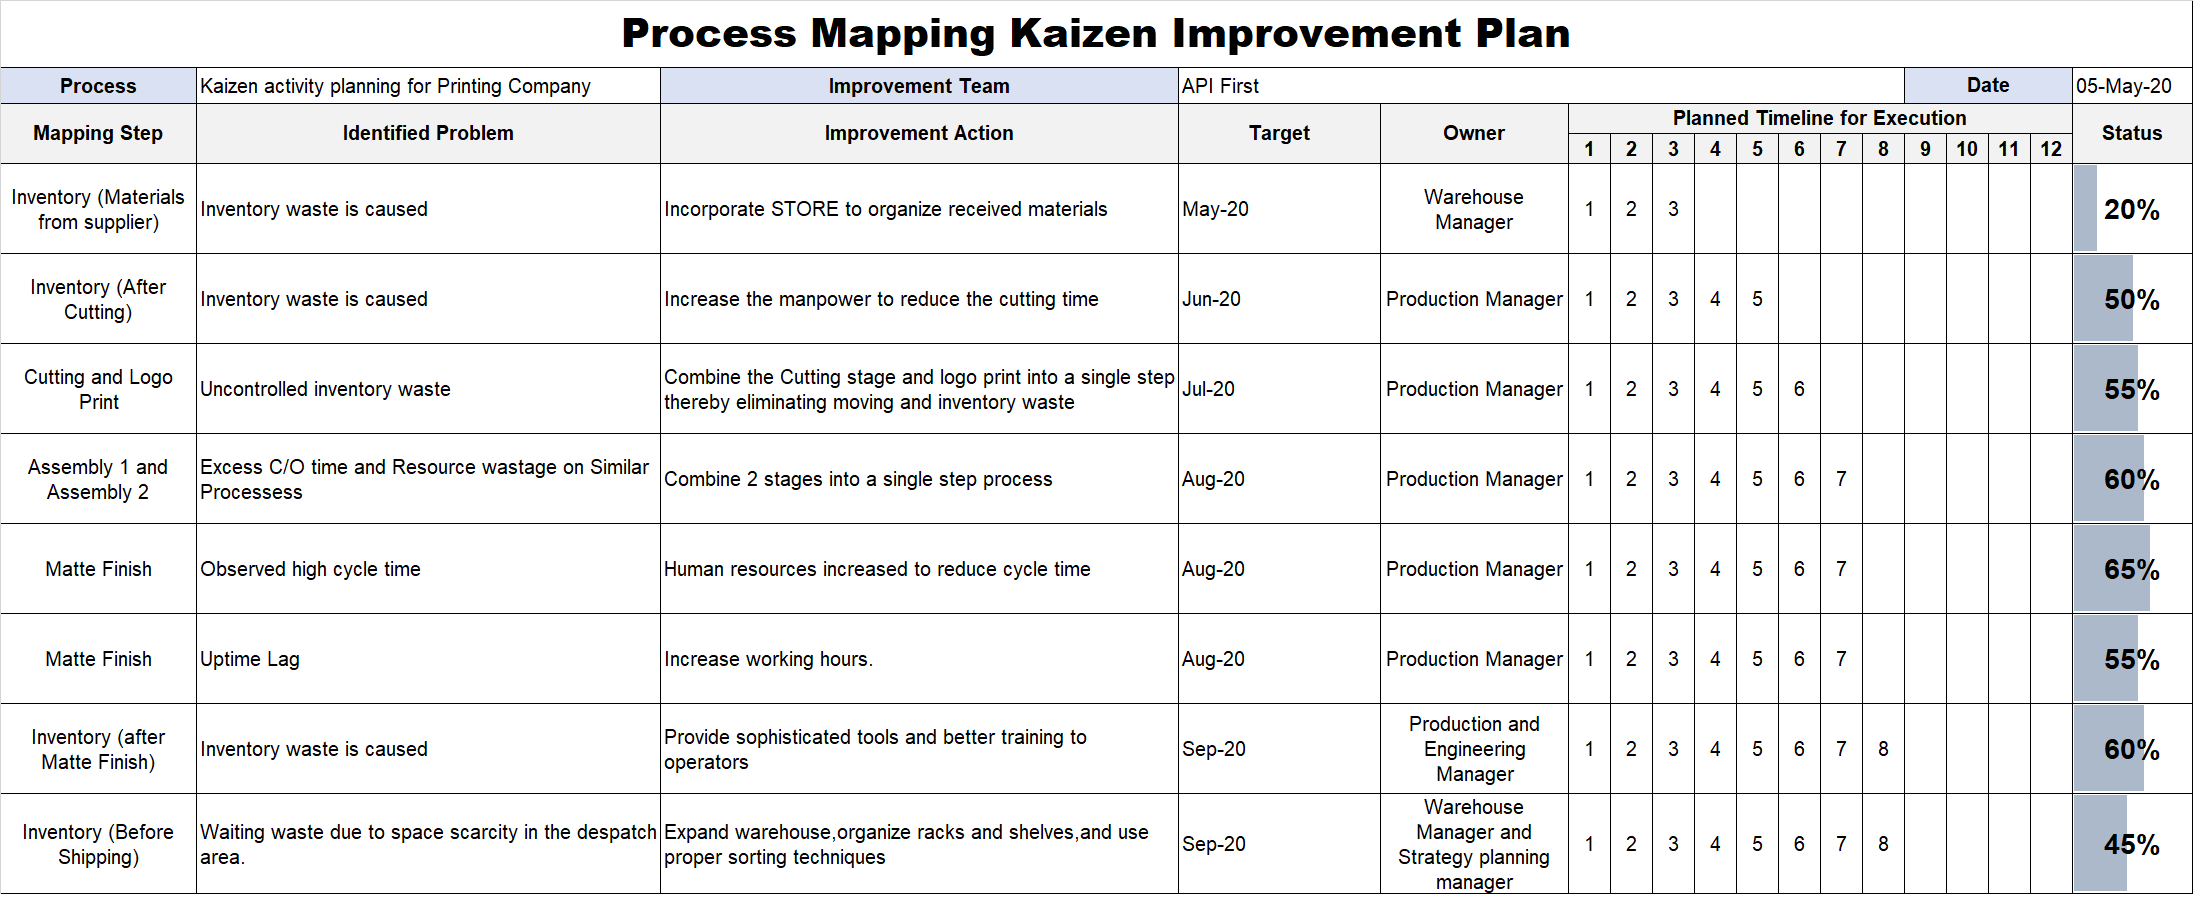
- Development of Improvement Plan
Implementation Plan is developed to establish the Future state of the process. This should consist of each improvement step one by one. The quantifiable goals and all the checkpoints for measuring the progress of the process should be included in the Improvement Plan. This is usually depicted by a Gantt chart. The chart shall depict the target date as when the improvement is expected to be completed and personnel responsible to achieving the target should be assigned to get the maximum output.
Advantages of Value Stream Mapping are as follows:
- Entire process flow can be visualised instead of a single process envision
- Decisions can be made regarding flow of information and materials
- Waste can be identified easily
- Helps in identifying restraints which limits the processes
- Lean tools and concepts are combined in the process
- Common language for manufacturing process is attained
- Delay in the process which causes resource drainage can be identified
- Link between flow of information and material is exhibited
- VSM is more clear than other layout diagrams and quantitative tools
- Bottomline can be increased with decreased waste
Value Stream Mapping can be used for improving the processes of industries to yield better profits by reducing product delays and wastes. It is extremely useful for continuous improvement of an organization with enhanced customer satisfaction. Team culture can also be improved by adoption of VSM. Thus, Value Stream Mapping can enhance the efficiency of the process.